2019-12-02 RESOURCES
Author: Cait Kirby
Read time: 8 minutes
Macro-level project-tracking: the big picture.
Macro-level organization spreadsheet.
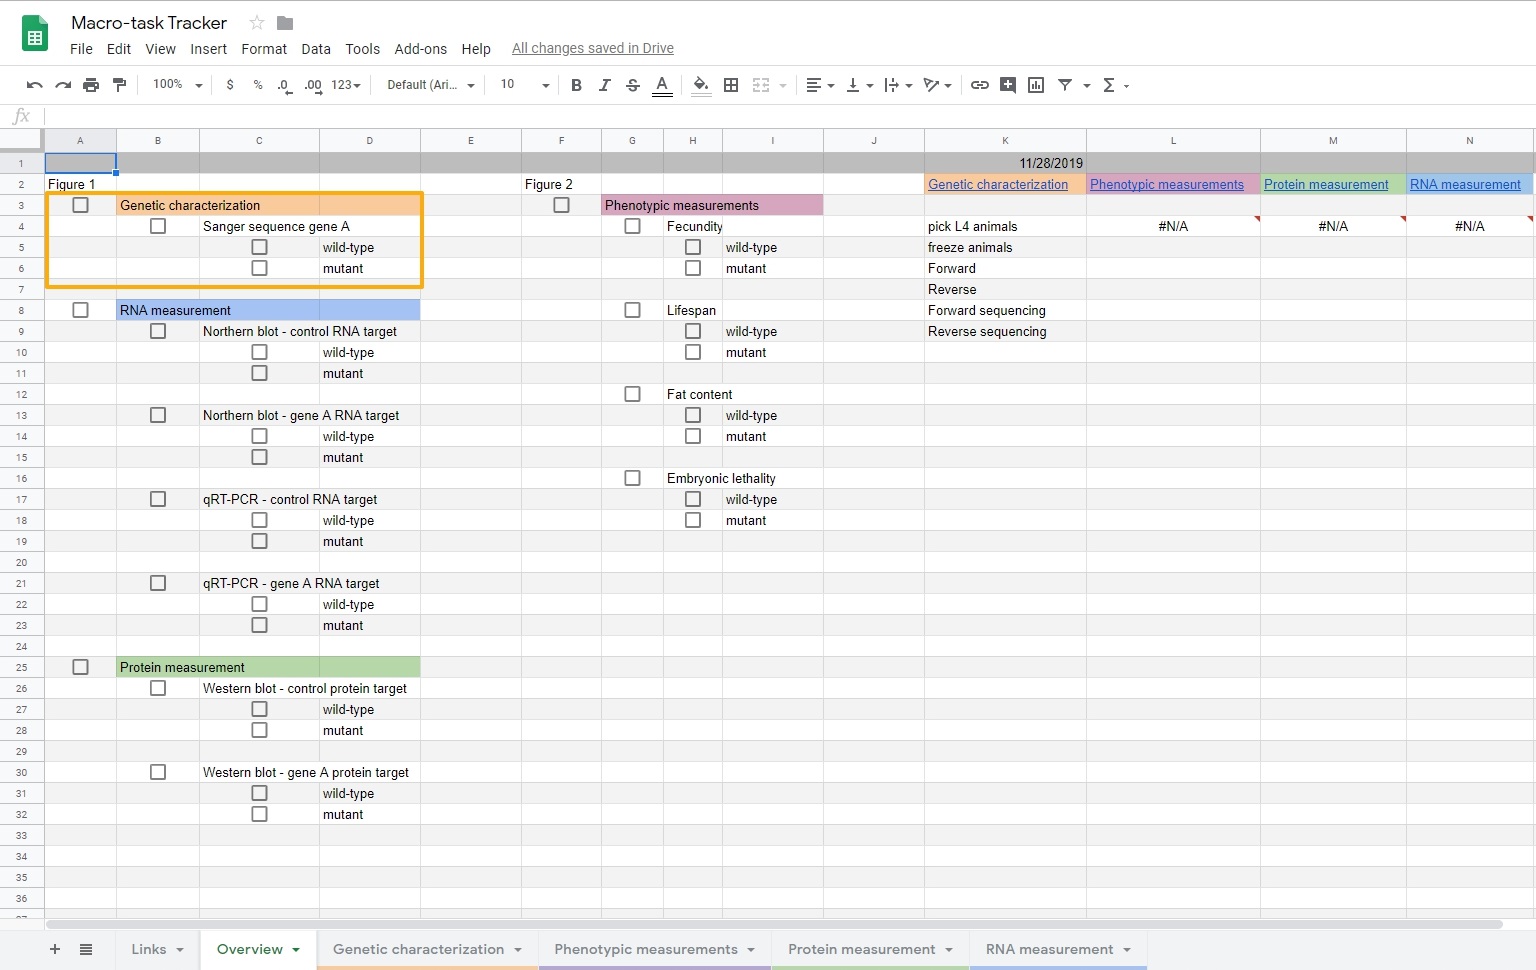
My macro-level spreadsheet is deceptively sophisticated, but seems so basic on the surface. Check it out below.
So why do I use a spreadsheet to organize the big-picture stuff?
Attention to granular detail is necessary for experimental success.
However, a focus on the big-picture goals of the project is crucial to remain on track and timely.
Thus, I utilize a birds'-eye-view spreadsheet that helps me maintain focus on the larger goals, from figures to papers to career-goals.
The specific structure for these spreadsheets varies based on the goal, but the overall idea remains the same: what are the high-level chunks of this project and how can I break them down?
For a paper, I plan out each figure, and break down each panel of the figure.
First, this is useful because it gets me thinking about the overall narrative of the paper.
When thinking about what I need to do, I often come up with new experimetns, or important controls.
Together, these strengthen the overall paper.
Second, this can help with estimating time until completion.
By breaking out all of the figures into experiments, I can see exactly how much needs to get done.
Since many of the bigger experiments are made up of tiny experiments I have done before, I can estimate the length of time to completion.
Third, this can help with prioritization.
By listing out all of the experiments, I can make informed choices about which experiments to prioritize.
I can see all the moving parts and even guess where I might get stuck.
This helps me make choices about which experiments might need to wait.
Finally, this can help with delegation and task-sharing.
By understanding what needs to get done, how long it will take, and how important each task is, I can make informed choices about asking for help and recruiting others.
Without a clear outline, I may not identify tasks that can easily be delegated.
Alternatively, without a clear outline, I may be so overwhelmed that I cannot even identify what I need help with.
Using this macro-level project-tracking tool, I can easily identify when and where I need help to keep the project moving forward.
Okay, so how do I use it?
I think it's best to walk through an example here.
Let's pretend that I have used CRISPR to edit gene A in my worms.
If I am exploring the phenotypic effects of a mutation in gene A, in figure 1 I might need to:
- characterize the mutation genetically by Sanger sequencing,
- determine if RNA is present via qRT-PCR,
- determine if protein is present via Western blot.
- fecundity,
- fat content,
- lifespan, and
- embryonic lethality.
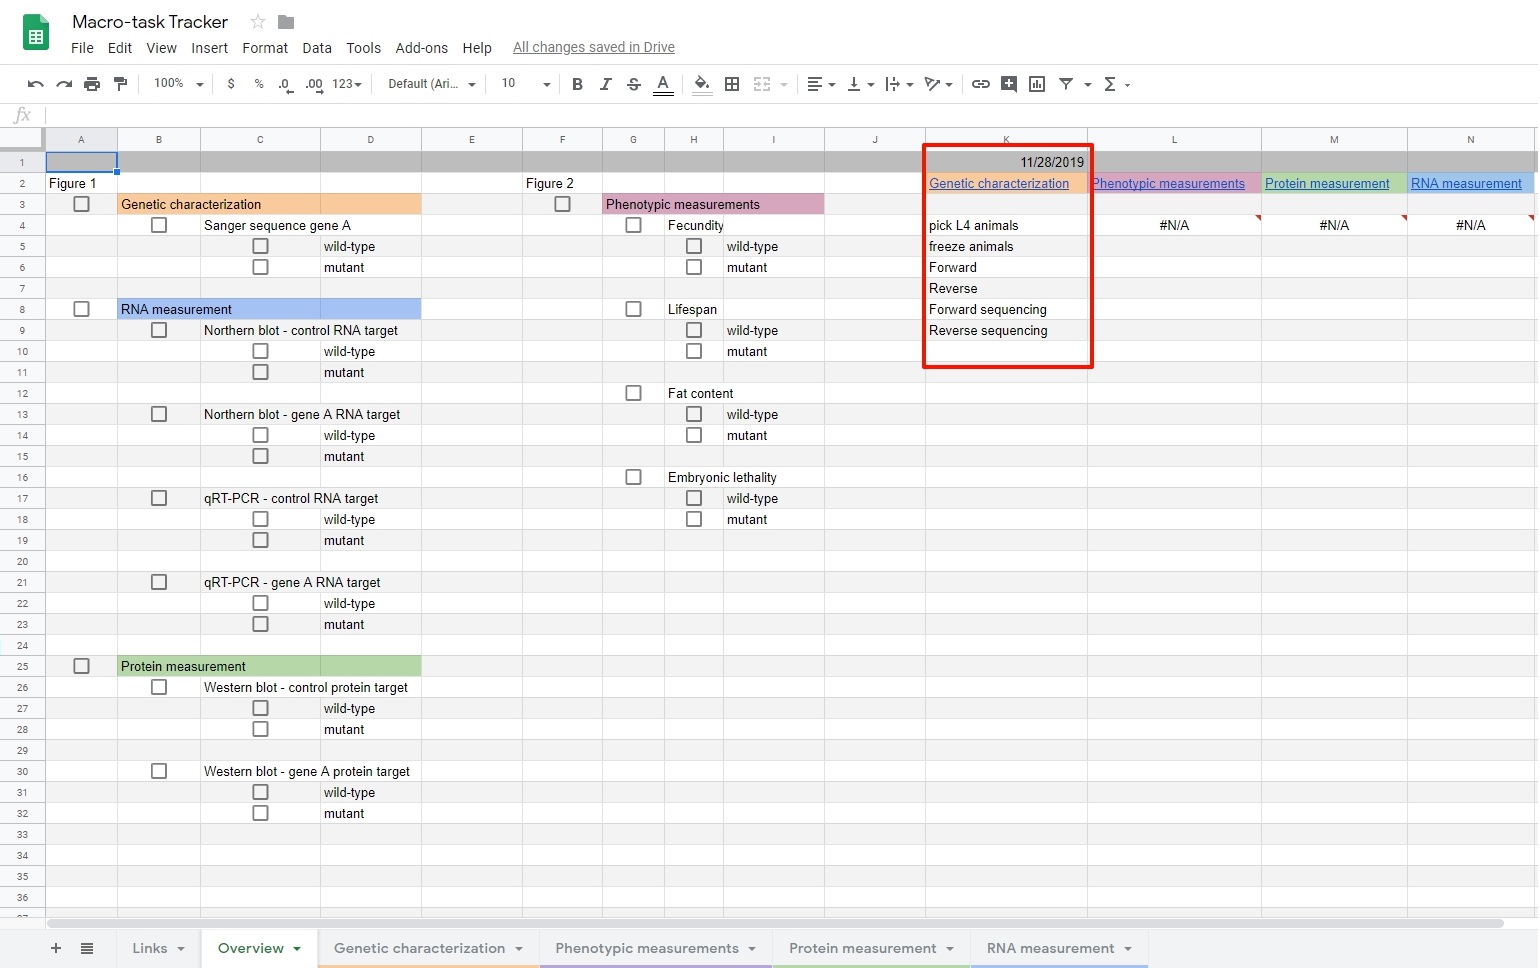
So if we focus on figure 1 genetic characterization, the "highest-level" checkboxes are shown in the orange rectangle:
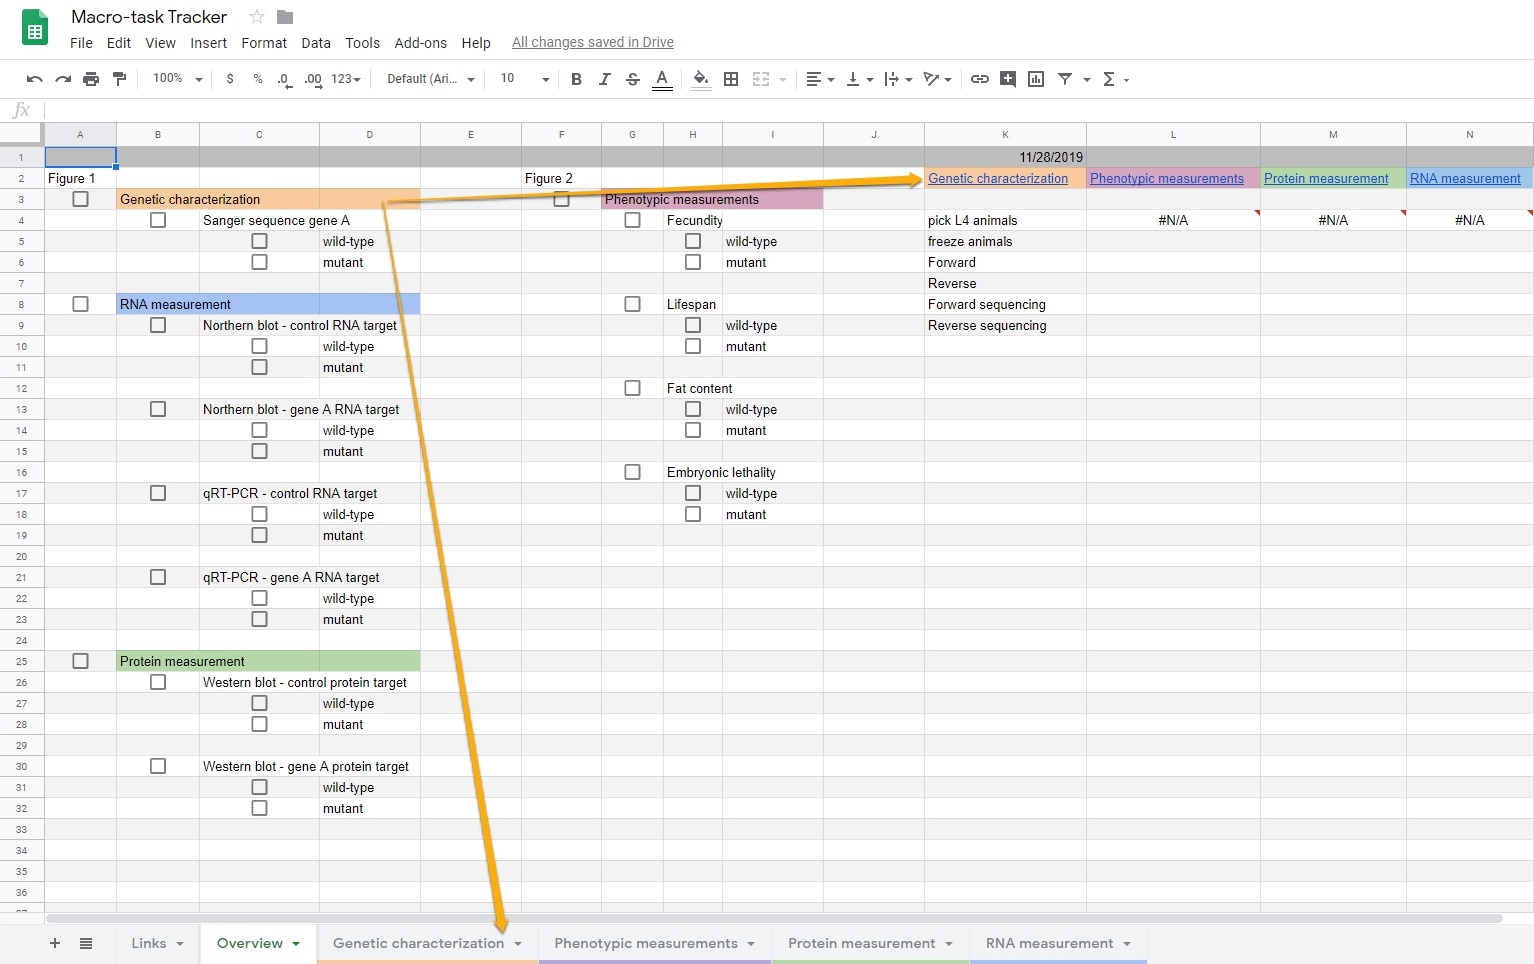
But this view is a little too high-level, so I need to focus in on the actual experiments required to complete Sanger sequencing, and check that box. I have a whole sheet just dedicated to the experiments required for Sanger sequencing. Everything related to the genetic characterization of this mutant is color-coded in orange. Further, there are two ways to get to that sheet. One at the bottom of the page, and one on the right side of the page. For now, let's click the the sheet at the bottom of the page.
On the right, in the red box, is the big-picture overview of the goal: DNA sequencing using the Sanger method. On the left, in green, are all the steps it will take to get those sequencing results. The blue arrows point to individual experiments, the red arrows point to tasks, and the pink arrows point to sub-tasks. You will notice that I've accomplished some of these tasks already: the empty checkboxes are filled with a white check on a gray background. I cannot fill the individual experiment boxes, until all the task and sub-task boxes are filled. I love the sense of accomplishment I feel when I check off a full individual experiment.
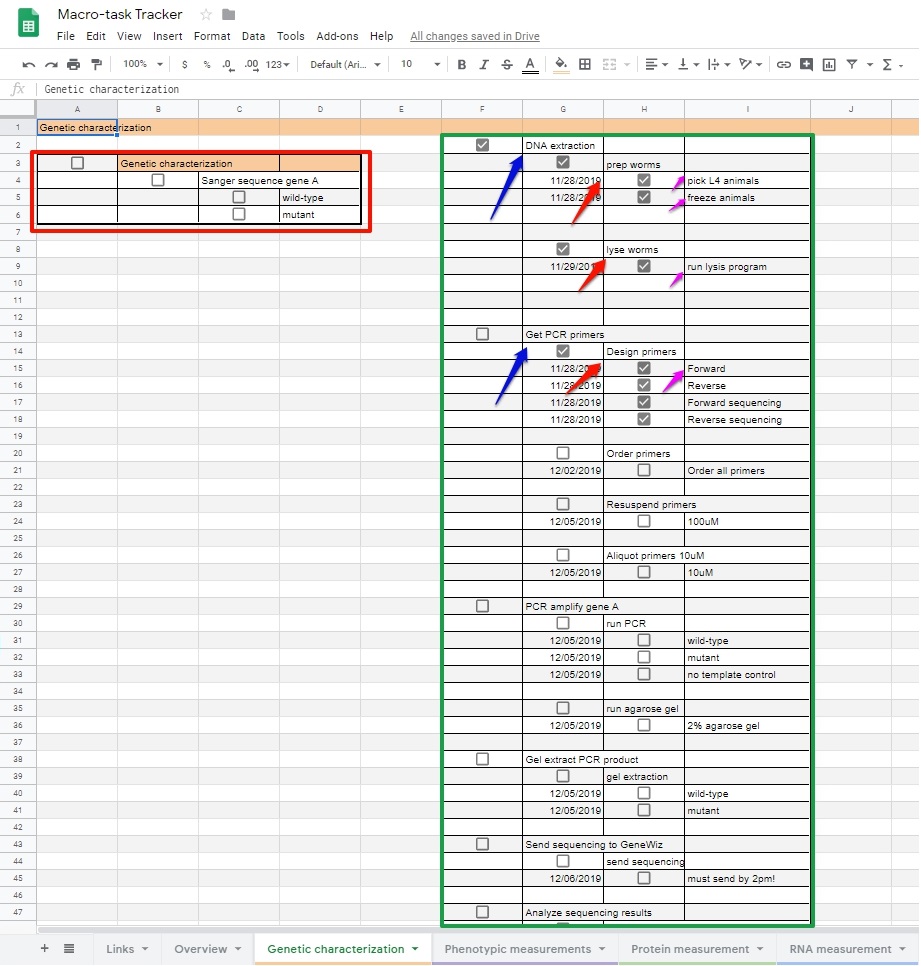
I also like to use these sheets for planning, so I include dates for each sub-task. Some sub-tasks build off of each other in a linear way, and I can use Google Sheets formulas to help with that planning. Otherwise, I just plan the experiments based on how much time for experiments I have in a given day. If I focus on the next experiment in my list, I need to get PCR primers. To do this, I must design, order, and then prepare my primers. I put those on my list to do today. To prevent me from missing tasks that are due each day, I use a filtering system on the "Overview" sheet at the bottom of the page, shown with a red arrow. Let's click that sheet.
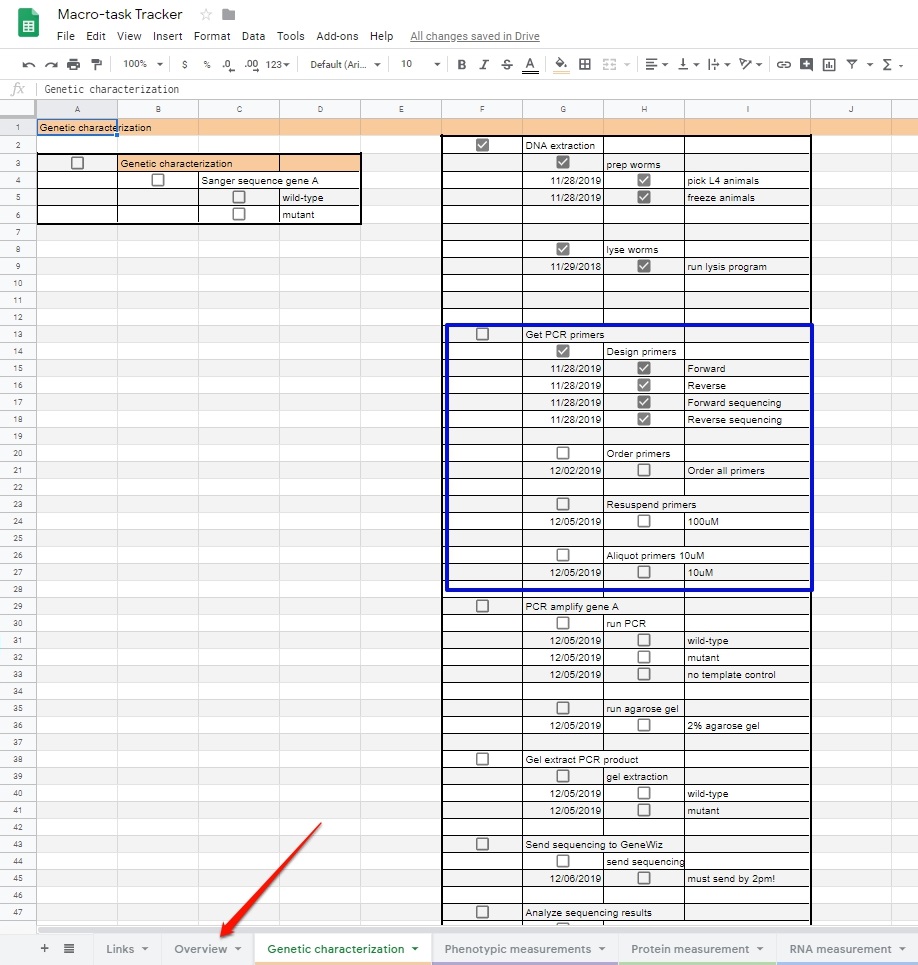
Clicking that sheet takes us back to that very first page. On this page, we can look over in the column on the right "Genetic Characterization." Below that, are all the tasks that have a due-date that matches today's date, shown in red. That's pretty nifty, huh? It's a somewhat complicated formula. Using this formula, I can just scan the Overview page to get an idea of how many tasks I have in a given day. Then I can navigate to the specific sheet in my macro spreadsheet to get the full details.
Taken together, I can keep track of the big-picture experiments at a high-level, and still make progress on the smaller tasks involved in each experiment.
If you are looking for a way to keep track of small tasks, check out my micro-level task-tracking sheet!
The two spreadsheets work together beautifully.
A final note:
You may be worried that setting up this spreadsheet will take a lot of work.
I agree, there is a lot of effort required at the beginning to figure out how to make this work for you.
But, once you've figured it out and you set it up once, the rest is just maintenance.
By using this setup, I have completed experiments that were 90% finished, but I could never find the time for the last 10%.
Further, I have been able to more easily "stack" experiments, just by taking the birds'-eye view. So, for me, the time it takes to set up is well worth it.
Get the resource:
Here is my template macro-level task-tracking spreadsheet via Google sheets.Make a copy in your own project folder and link to your micro-tracking sheet!
Go back to the organization tools blog post.